Cleaning data with SQL
Two messy CSV exports — an Orders table and a Products table — cleaned end-to-end in Snowflake. Profile first, parse five price formats and five date formats, flag bad rows instead of deleting them, then join.
The work starts before any fix is written: counting nulls, spotting duplicates, mapping every format inconsistency. Then the pipeline standardizes casing, strips prices with REPLACE and TRY_TO_NUMBER, resolves dates with a COALESCE + TRY_TO_DATE cascade, normalizes sizes and colours, and leaves the raw tables untouched.
The raw load
Two CSVs landed in DATACLEANINGPROJECT.ORDERS_PRODUCTS. Orders: 5,030 rows. Products: 20 rows.
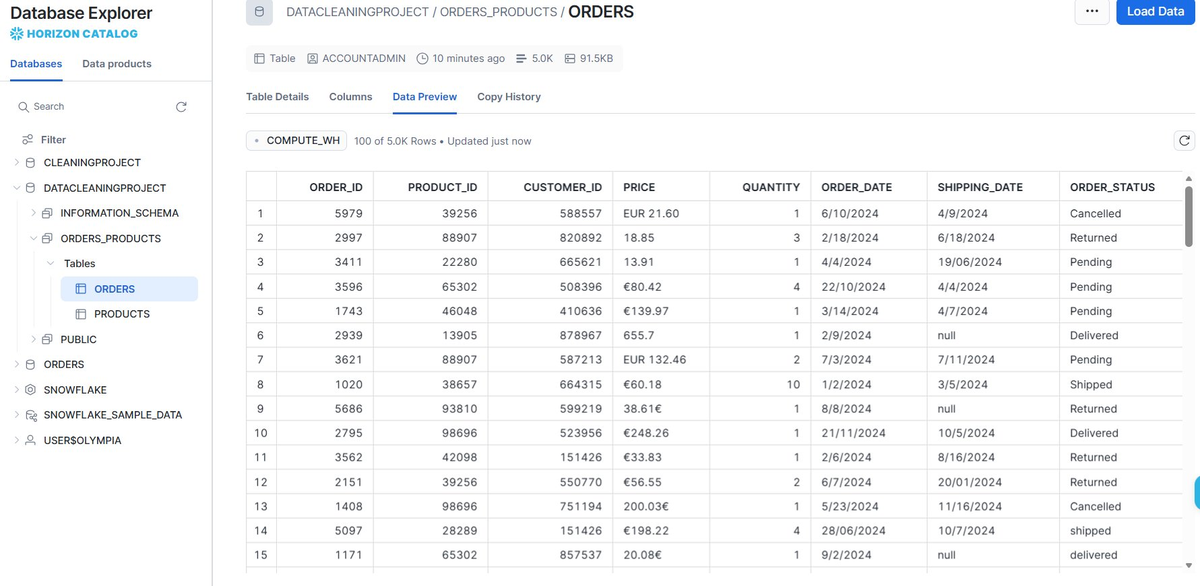
Raw ORDERS preview — mixed price formats, inconsistent dates, nulls visible.
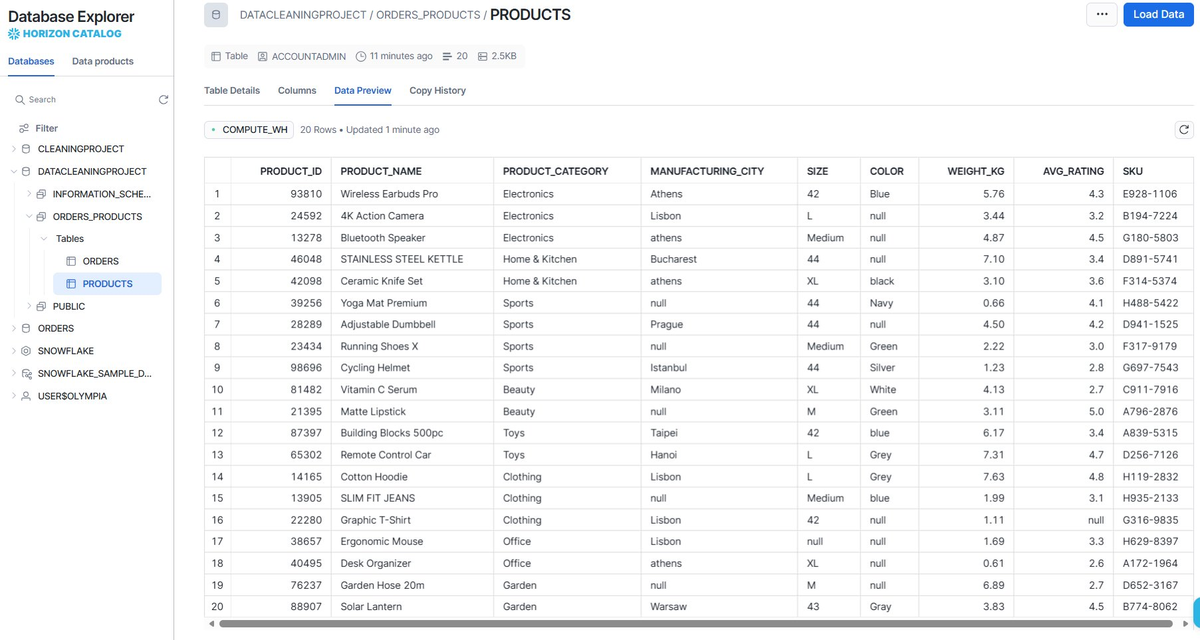
Raw PRODUCTS — city names in random casing, ALL-CAPS product names, null colours.
Stage 1 — profiling
No point writing fixes without knowing what you are fixing. COUNT_IF for true NULLs and blank strings. GROUP BY on price to see every format. GROUP BY on all eight columns for exact duplicates.
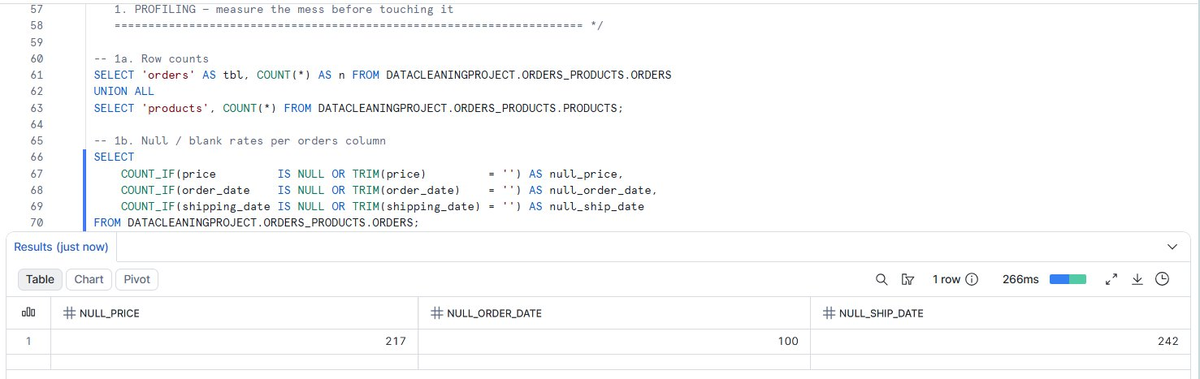
Null audit — 217 missing prices · 100 missing order dates · 242 missing shipping dates.
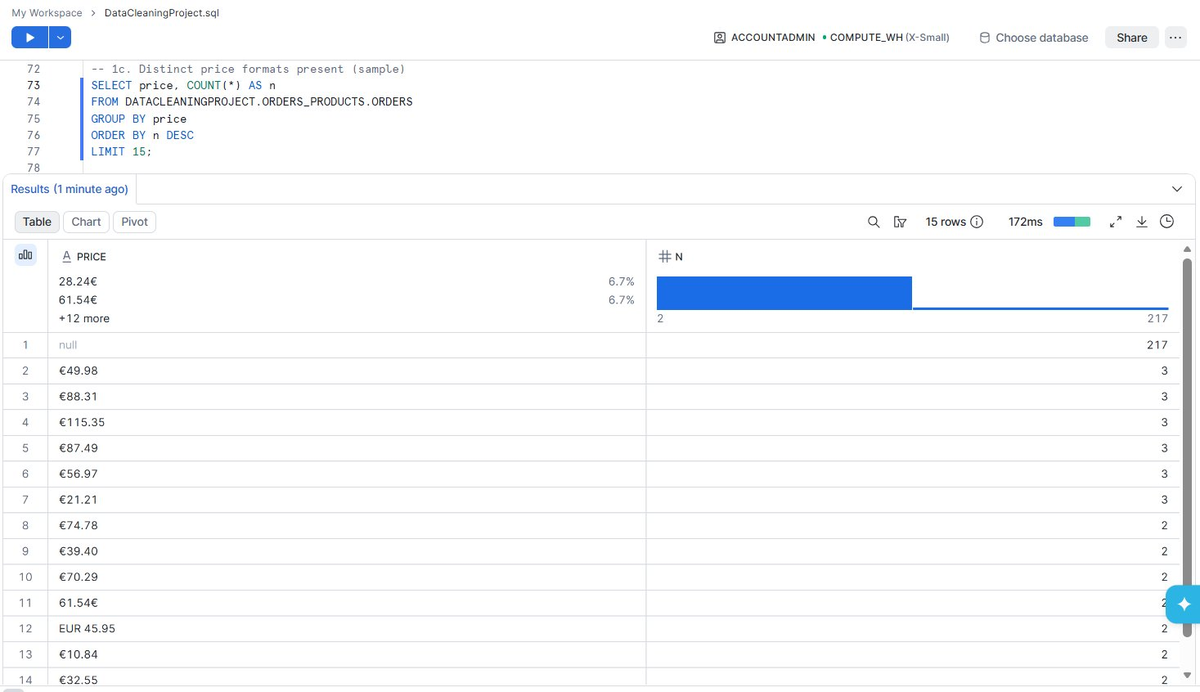
Price format audit — five distinct formats, plus 217 nulls. This is why Stage 3 needs REPLACE.
30 duplicate row groups, all with copies = 2. Casing splits Blue/blue, Gray/Grey, black/Black into separate buckets.
Stage 2 — products first
Products is cleaned first because Orders references it. One CREATE OR REPLACE TABLE products_clean AS SELECT. The raw table stays.
- product_name: INITCAP + TRIM + REGEXP_REPLACE — STAINLESS STEEL KETTLE becomes Stainless Steel Kettle.
- manufacturing_city: INITCAP(TRIM(…)) — athens → Athens.
- size: CASE mapping every variant to a standard (medium → M; 42/44 kept).
- color: INITCAP plus REPLACE to merge Gray → Grey. Blanks to NULL.
- weight_kg / avg_rating: TRY_TO_NUMBER(NULLIF(…)).
- product_label: CONCAT-derived — Electronics — Wireless Earbuds Pro.
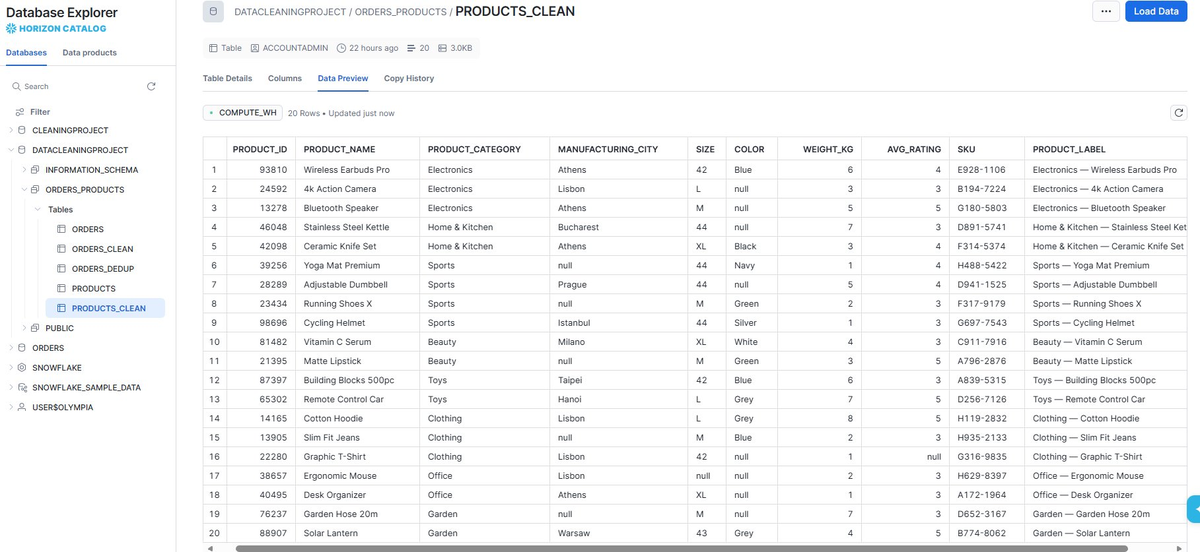
PRODUCTS_CLEAN — 20 rows, everything standardized, product_label ready for dashboards.
athens is gone. STAINLESS STEEL KETTLE is gone. Gray and Grey are one.
Stage 3 — orders
Messier, so two sub-steps: duplicates out, then parse and flag.
SELECT DISTINCT drops 30 duplicate rows — 5,030 become 5,000 — as its own step so the deduplication is auditable. A CTE then parses; the outer SELECT adds data-quality flags without deleting rows.
- price → price_eur: three REPLACE calls strip EUR / € / spaces, then TRY_TO_NUMBER.
- order_date / shipping_date: COALESCE of five TRY_TO_DATE calls — first non-NULL wins.
- order_status: INITCAP(LOWER(TRIM(…))) into one canonical form.
- Flags: flag_missing_price, flag_negative_price, flag_price_outlier, flag_ship_before_order.
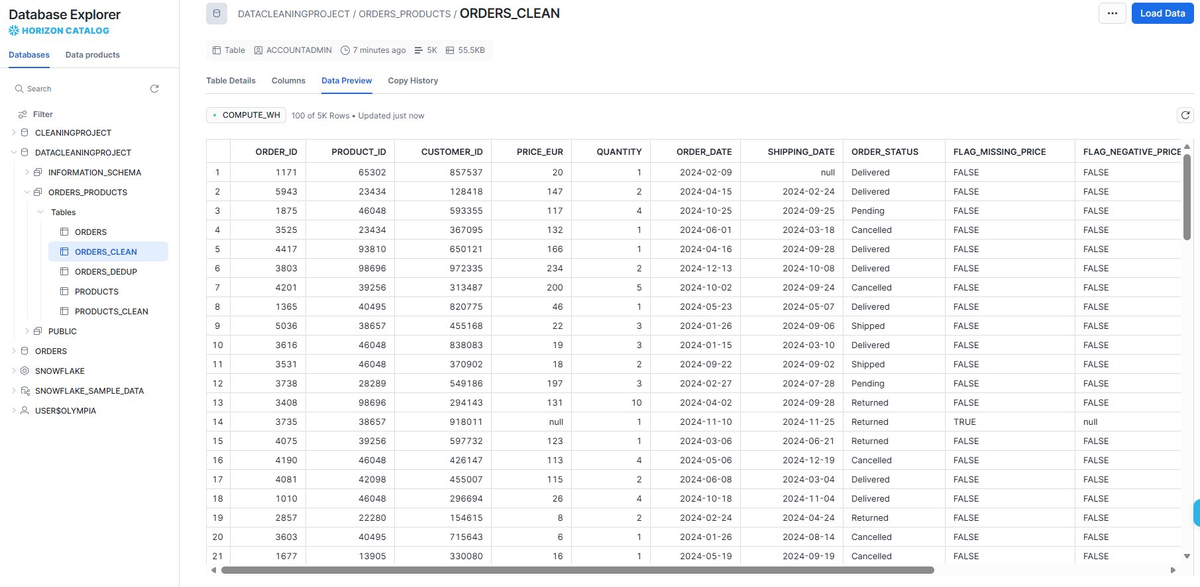
ORDERS_CLEAN — clean price column, consistent dates, normalized status, flags working.
5,000 rows with a numeric price, consistent dates, one status format, and four audit flags ready for filtering.
Stage 4 — integrity
Cleaning columns is half the job. The two tables still have to make sense together.
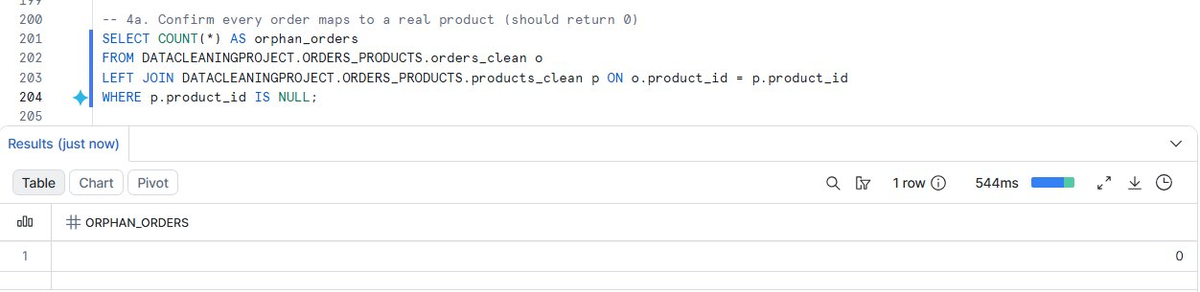
Orphan check — LEFT JOIN orders to products. Result: 0. Every order maps to a valid product.
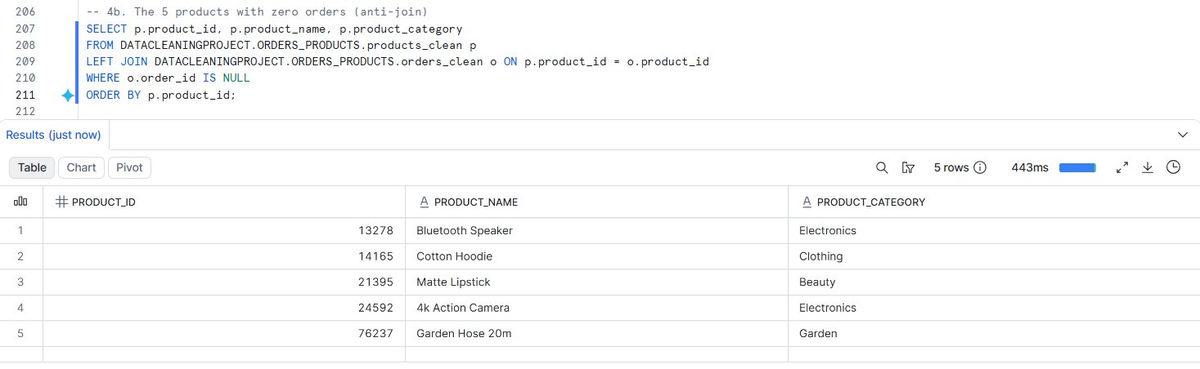
Five products with no order history — not a data error, a business flag. Slow movers, new listings, or worth a look.
Primary and foreign keys in Snowflake are informational. Declaring them documents the model and helps BI tools see the join.
Stage 5 — the analysis view
V_ORDERS_ANALYSIS is a saved query that re-runs against the latest clean data. It joins both tables, adds LINE_TOTAL_EUR (price × quantity), pulls product details, and filters anything flagged as bad. One view. One source of truth.
Revenue by category
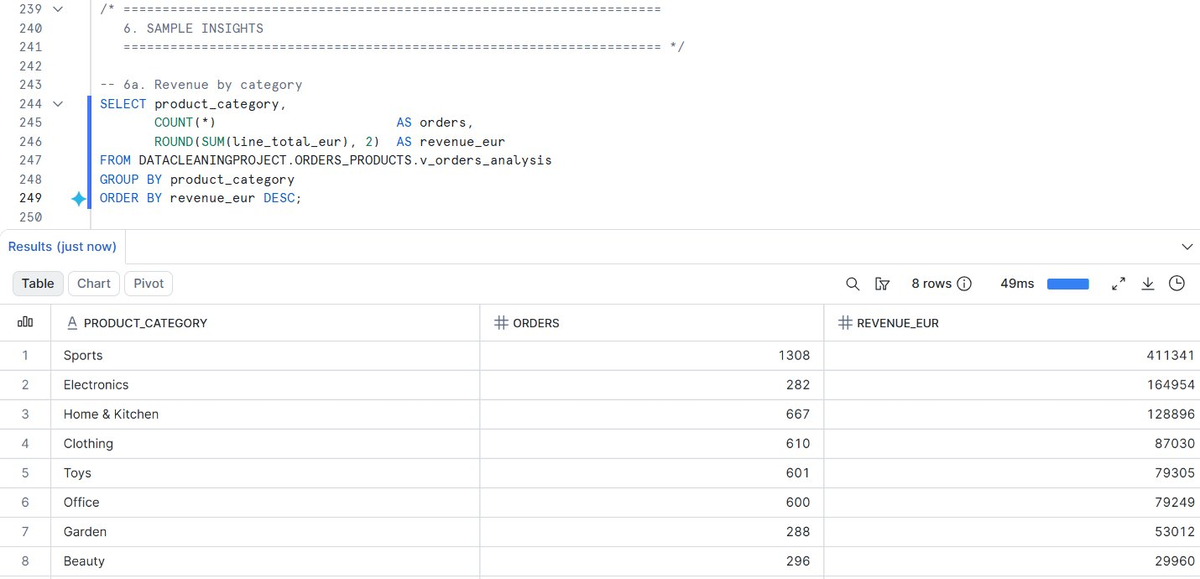
Sports leads at EUR 411,341. Electronics has fewer orders but much higher revenue per order.
Monthly revenue
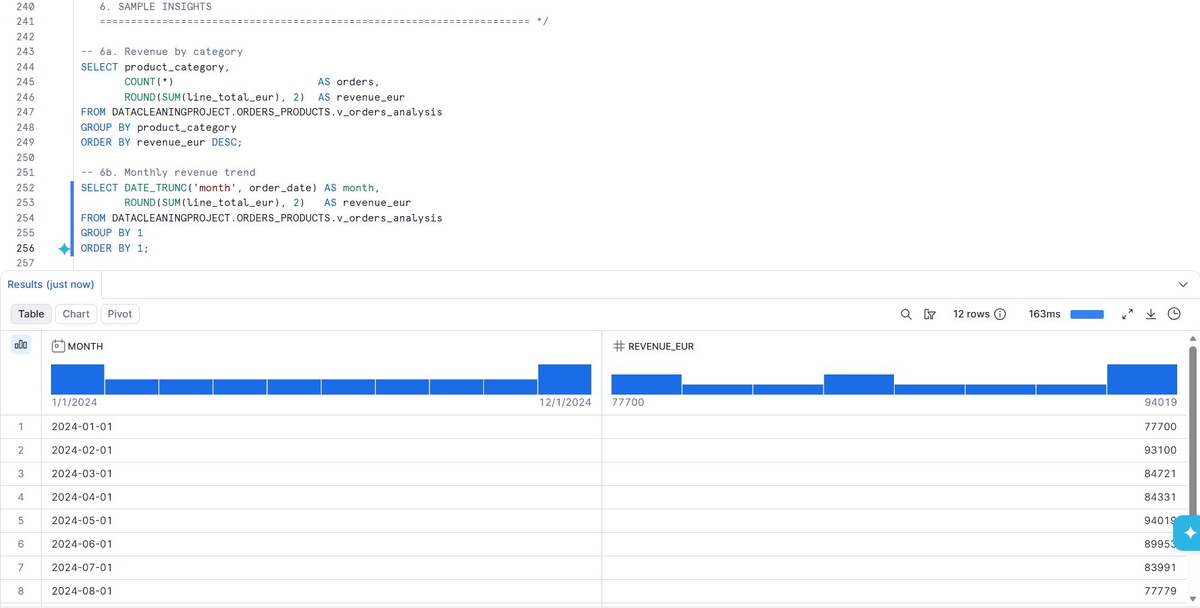
DATE_TRUNC('month') — a 12-row series, EUR 77K–94K across 2024. May is the peak. No violent seasonality.
Top 5 products
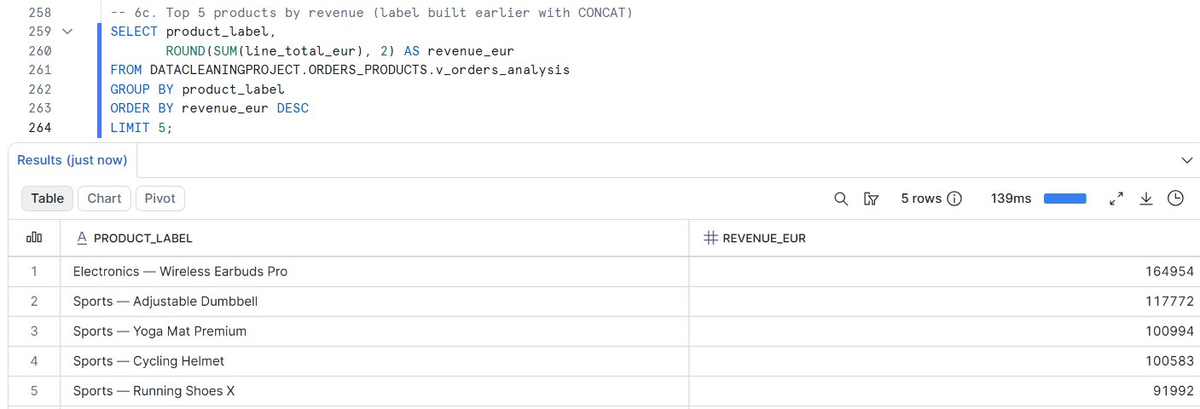
Wireless Earbuds Pro leads at EUR 164,954. Sports takes four of five spots — which lines up with the category view.
Follow-up: this same dataset is charted twice in a later piece, once raw (the way an AI dashboard reads it) and once after cleaning, in Power BI. The raw view understates revenue by 69%. How much of your dashboard is just the mess you never cleaned? →